Kinh Tế Năng Lượng Gió
Giới Thiệu
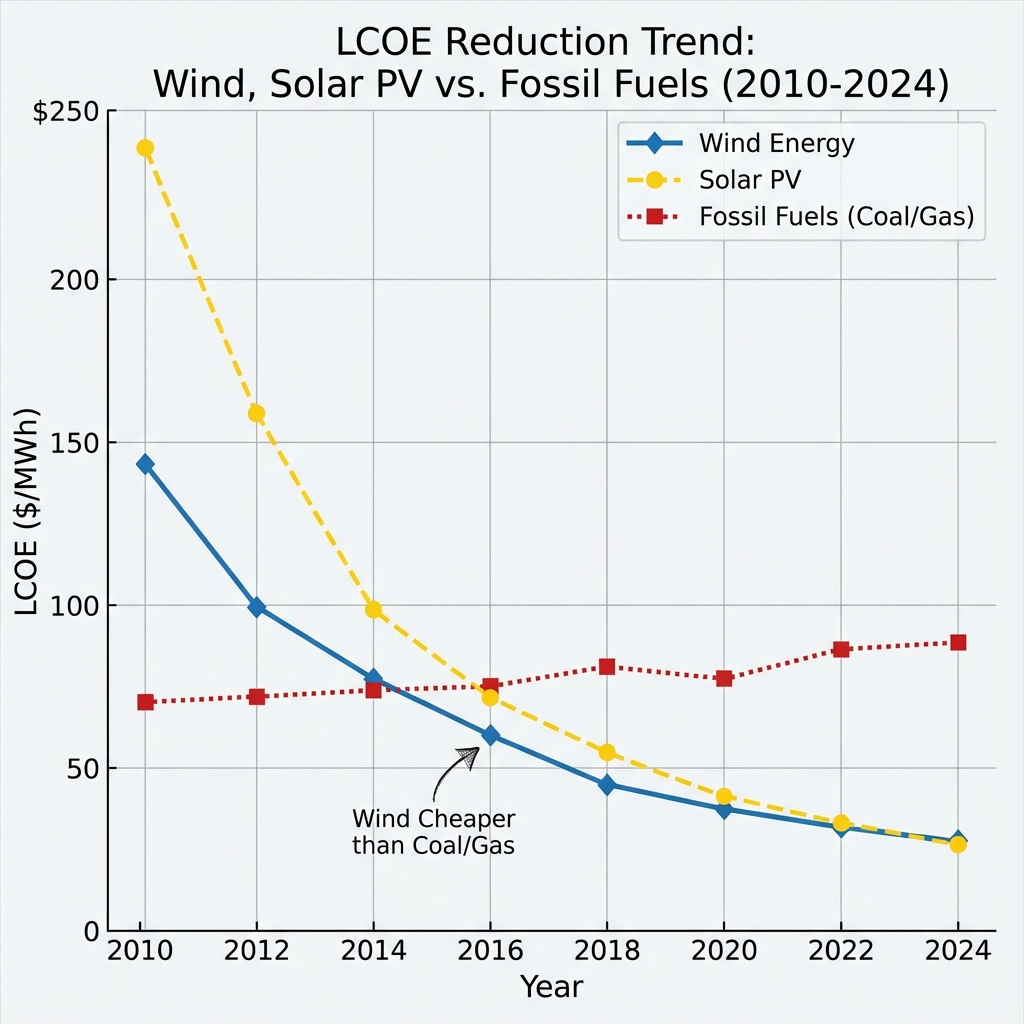
Kinh tế năng lượng gió đã chuyển đổi từ công nghệ đắt đỏ sang nguồn điện cạnh tranh nhất trong nhiều thị trường. Với LCOE giảm 70% trong thập kỷ qua, năng lượng gió hiện là xương sống của chuyển đổi năng lượng toàn cầu. Chương này phân tích toàn diện các khía cạnh kinh tế từ vi mô đến vĩ mô.
Tổng Quan Kinh Tế Năng Lượng Gió
Hình: Evolution của chi phí năng lượng gió và so sánh với các nguồn khác
Key economic indicators (2024):
- Global investment: $200 billion/year
- LCOE onshore: $0.02-0.06/kWh
- LCOE offshore: $0.05-0.12/kWh
- Jobs created: 3.4 million globally
- Market growth: 15% CAGR
Levelized Cost of Energy (LCOE)
1. Khái Niệm và Phương Pháp Tính
Định Nghĩa LCOE
Formula cơ bản:
LCOE = (Total Life Cycle Costs) / (Total Lifetime Energy Production)
LCOE = Σ(It + Mt + Ft)/(1+r)^t / Σ(Et)/(1+r)^t
Trong đó:
- It: Investment costs năm t
- Mt: O&M costs năm t
- Ft: Fuel costs năm t (= 0 cho wind)
- Et: Electricity generation năm t
- r: Discount rate
- t: Year (1 to n)
Chi Tiết Các Thành Phần
Investment costs (CAPEX):
- Turbine: 65-75% of total
- Foundation: 10-15%
- Grid connection: 10-15%
- Development: 5-10%
O&M costs (OPEX):
- Scheduled maintenance: 40-50%
- Unscheduled repairs: 20-30%
- Insurance: 10-15%
- Land lease: 5-10%
- Administration: 10-15%
Hình: Phân tích chi tiết các thành phần LCOE
2. LCOE Trends và Projections
Historical Cost Reduction
Onshore wind LCOE evolution:
| Year | Global Average | Best Sites | Drivers | |------|----------------|------------|---------| | 2010 | $0.085/kWh | $0.060/kWh | Small turbines | | 2015 | $0.065/kWh | $0.045/kWh | Scaling up | | 2020 | $0.040/kWh | $0.025/kWh | Technology maturity | | 2024 | $0.035/kWh | $0.020/kWh | Market competition | | 2030p | $0.025/kWh | $0.015/kWh | Further optimization |
Offshore wind dramatic improvements:
- 2010: $0.16/kWh (nascent industry)
- 2020: $0.08/kWh (scale + technology)
- 2024: $0.06/kWh (competitive auctions)
- 2030p: $0.04/kWh (floating + scale)
Cost Reduction Drivers
Technology factors (50% of reduction):
- Turbine scaling: Power ∝ D², Cost ∝ D^2.5
- Capacity factor: 25% → 50%+ improvement
- Reliability: 95% → 98%+ availability
- Lifetime: 20 → 25-30 years
Market factors (30% of reduction):
- Competition: Global supply chains
- Volume: Mass production benefits
- Learning rate: 15-20% per doubling
- Risk reduction: Proven technology
Financial factors (20% of reduction):
- Cost of capital: Risk perception ↓
- PPA structures: Long-term certainty
- Policy stability: Investment confidence
- Insurance costs: Claims history ↓
3. Regional LCOE Variations
Geographic Factors
Wind resource impact:
LCOE ∝ 1/(Capacity Factor)
CF impact:
- 20% CF → $0.08/kWh
- 30% CF → $0.053/kWh
- 40% CF → $0.04/kWh
- 50% CF → $0.032/kWh
Regional comparison (2024):
| Region | Onshore LCOE | Offshore LCOE | Key Factors | |--------|--------------|---------------|-------------| | USA Great Plains | $0.02-0.04 | N/A | Excellent wind | | Northern Europe | $0.03-0.05 | $0.05-0.08 | Mature market | | China | $0.025-0.045 | $0.06-0.10 | Low costs | | India | $0.03-0.055 | N/A | Growing market | | Vietnam | $0.04-0.07 | $0.08-0.12 | Developing |
Capital Costs (CAPEX)
1. Turbine Costs
Price Evolution
Historical turbine prices:
- 2010: $1,500-2,000/kW
- 2015: $1,000-1,400/kW
- 2020: $700-900/kW
- 2024: $600-800/kW
Factors affecting turbine price:
- Technology: DD vs geared, power rating
- Market conditions: Steel prices, demand
- Contract size: Volume discounts
- Local content: Manufacturing location
- Warranty terms: 2-5 year coverage
Hình: Chi tiết giá thành các components của turbine
Component Cost Analysis
2MW onshore turbine example:
| Component | Cost ($k) | % of Total | |-----------|-----------|------------| | Rotor (blades + hub) | 400-500 | 30-35% | | Nacelle | 450-550 | 35-40% | | Tower | 200-300 | 15-20% | | Control system | 50-100 | 5-7% | | Transport | 50-100 | 5-7% | | Total | 1,200-1,600 | 100% |
2. Balance of Plant (BoP)
Onshore BoP Costs
Typical breakdown ($/kW):
-
Foundation: $100-200/kW
- Concrete: $50-100/kW
- Rebar: $30-50/kW
- Excavation: $20-50/kW
-
Roads & hardstands: $50-100/kW
- Access roads: $30-60/kW
- Crane pads: $20-40/kW
-
Electrical infrastructure: $100-150/kW
- MV cables: $40-60/kW
- Substation: $40-60/kW
- Grid connection: $20-30/kW
Offshore BoP Costs
Significantly higher than onshore:
-
Foundation: $500-1,500/kW
- Monopile: $500-800/kW
- Jacket: $800-1,200/kW
- Floating: $1,000-1,500/kW
-
Electrical: $300-500/kW
- Array cables: $100-200/kW
- Export cable: $100-200/kW
- Offshore substation: $100-150/kW
-
Installation: $200-400/kW
- Vessel costs: $150-300/kW
- Weather risk: $50-100/kW
3. Development Costs
Pre-Construction Expenses
Breakdown by activity:
| Activity | Cost (% of CAPEX) | Duration | |----------|-------------------|----------| | Site assessment | 0.5-1% | 1-2 years | | Environmental studies | 0.5-1% | 2-3 years | | Permits & approvals | 0.5-1% | 2-4 years | | Engineering design | 1-2% | 1 year | | Financing costs | 2-3% | 6 months | | Total | 5-8% | 3-5 years |
Risk factors:
- Permitting delays: Major cost driver
- Community opposition: Redesign costs
- Grid capacity: Upgrade requirements
- Environmental constraints: Mitigation costs
Operating Costs (OPEX)
1. Maintenance Strategies
Preventive vs Corrective
Cost comparison:
| Strategy | Cost ($/kW/yr) | Availability | Risk | |----------|----------------|--------------|------| | Run-to-failure | 10-20 | 90-93% | High | | Time-based | 20-30 | 94-96% | Medium | | Condition-based | 25-35 | 96-98% | Low | | Predictive | 30-40 | 97-99% | Very low |
Optimal strategy evolution:
- Years 1-2: Warranty period, minimal intervention
- Years 3-10: Preventive + condition monitoring
- Years 10-20: Predictive maintenance critical
- Years 20+: Life extension decisions
O&M Cost Breakdown
Typical onshore O&M (€/MWh):
- Service & parts: 6-8 €/MWh
- Insurance: 2-3 €/MWh
- Land lease: 2-4 €/MWh
- Administration: 1-2 €/MWh
- Other: 1-2 €/MWh
- Total: 12-20 €/MWh
Hình: Evolution của O&M costs qua lifetime
2. Performance Optimization
Availability Improvements
Industry benchmarks:
- Time-based availability: 95-98%
- Energy-based availability: 94-97%
- Capacity factor: Site-dependent
Lost production causes:
- Grid issues: 25-35%
- Turbine faults: 40-50%
- Environmental: 10-15%
- Maintenance: 10-15%
Advanced O&M Technologies
Digital solutions ROI:
- Condition monitoring: 10-15% O&M reduction
- Predictive analytics: 20-30% downtime reduction
- Drone inspections: 50% inspection cost reduction
- Remote operations: 30% site visit reduction
3. Insurance and Risk
Insurance Types
Coverage categories:
- Construction All Risk (CAR): During installation
- Operational All Risk (OAR): Operating period
- Business Interruption (BI): Lost revenue
- Third Party Liability: Public safety
Premium trends:
- 2010: 1.0-1.5% of turbine value
- 2020: 0.5-0.8% of turbine value
- 2024: 0.3-0.6% of turbine value
Risk mitigation impact:
- OEM service contract: -20% premium
- Proven technology: -15% premium
- Good site conditions: -10% premium
- Experienced operator: -10% premium
Financial Structures
1. Project Finance
Typical Structure
Sources of funding:
- Equity: 20-40% (Developer, investors)
- Debt: 60-80% (Banks, bonds)
- Grants: 0-10% (Government support)
Key financial metrics:
- Debt Service Coverage Ratio (DSCR): 1.3-1.5x
- Loan Life Coverage Ratio (LLCR): 1.5-2.0x
- Project IRR: 6-12% (unlevered)
- Equity IRR: 10-20% (levered)
Hình: Typical wind project financial structure
Cost of Capital
WACC calculation:
WACC = (E/V) × Re + (D/V) × Rd × (1-Tc)
Typical values (2024):
- Risk-free rate: 3-4%
- Equity risk premium: 5-8%
- Debt margin: 1.5-3%
- WACC range: 5-8%
2. Revenue Models
Power Purchase Agreements (PPA)
PPA structures:
| Type | Price Risk | Volume Risk | Typical Duration | |------|------------|-------------|------------------| | Fixed price | Buyer | Developer | 15-25 years | | Indexed | Shared | Developer | 10-20 years | | Merchant | Developer | Developer | Spot market | | Virtual PPA | Financial hedge | Developer | 10-15 years |
PPA price trends:
- 2015: $50-80/MWh
- 2020: $30-50/MWh
- 2024: $25-40/MWh
- Record lows: <$20/MWh (exceptional sites)
Government Support Mechanisms
Evolution of support schemes:
-
Feed-in Tariffs (FiT): Fixed price guarantee
- Pros: Revenue certainty
- Cons: No market exposure
-
Renewable Obligation Certificates (ROC): Quota system
- Pros: Market-based
- Cons: Price volatility
-
Contracts for Difference (CfD): Two-way protection
- Pros: Risk sharing
- Cons: Complex structure
-
Green Certificates: Environmental value
- Pros: Additional revenue
- Cons: Market dependent
3. Tax Incentives
Production Tax Credit (USA)
PTC structure:
- Value: $27.5/MWh (2024, inflation adjusted)
- Duration: 10 years production
- Phase-out: Planned transition to technology-neutral
Economic impact:
- LCOE reduction: $15-20/MWh
- Project viability: Enables marginal sites
- Investment driver: $billions mobilized
Investment Tax Credit Option
ITC alternative:
- Value: 30% of project cost
- Timing: Year 1 benefit
- Trade-off: PTC vs ITC analysis
Decision factors:
- High CAPEX: Favor ITC
- High capacity factor: Favor PTC
- Tax capacity: Corporate structure
Market Dynamics
1. Electricity Markets
Market Structures
Types of markets:
| Market Type | Characteristics | Wind Impact | |-------------|-----------------|-------------| | Regulated | Utility monopoly | PPA based | | Deregulated | Competition | Price taker | | Capacity markets | Reliability payments | Additional revenue | | Ancillary services | Grid support | Growing opportunity |
Price formation:
- Merit order: Wind = zero marginal cost
- Price suppression: High wind → low prices
- Negative prices: Oversupply situations
- Volatility: Intermittency impacts
Hình: Wind impact on electricity merit order
Revenue Optimization
Strategies:
- Forecasting accuracy: Reduce imbalance costs
- Market timing: Optimize bidding strategy
- Portfolio effects: Diversification benefits
- Storage integration: Arbitrage opportunities
- PPA structuring: Risk/return balance
2. Competitive Auctions
Global Auction Results
Record low bids:
| Country | Year | Price ($/MWh) | Technology | |---------|------|---------------|------------| | Saudi Arabia | 2021 | 16.4 | Onshore | | Brazil | 2022 | 17.5 | Onshore | | Morocco | 2020 | 19.7 | Onshore | | UK | 2022 | 48.5 | Offshore | | Denmark | 2021 | 0 (negative) | Offshore |
Auction design impact:
- Price-only: Lowest cost wins
- Multi-criteria: Price + local content + etc.
- Ceiling price: Maximum acceptable
- Pay-as-bid vs uniform: Settlement method
Bidding Strategies
Key considerations:
- Site quality: Resource assessment critical
- Scale economies: Larger projects advantage
- Technology choice: Latest = lowest LCOE
- Risk allocation: Aggressive vs conservative
- Market intelligence: Competitor analysis
3. Corporate Renewable Purchasing
Corporate PPA Growth
Market size:
- 2015: 2 GW globally
- 2020: 10 GW globally
- 2023: 20 GW globally
- 2025p: 30+ GW globally
Key drivers:
- ESG commitments: Net zero targets
- Price hedging: Long-term stability
- Additionality: New renewable capacity
- Brand value: Green credentials
Major corporate buyers:
- Tech giants: Google, Amazon, Microsoft
- Manufacturing: Steel, aluminum, chemicals
- Retail: Walmart, Target, IKEA
- Finance: Banks, insurance companies
Economic Impact Analysis
1. Macroeconomic Effects
GDP Contribution
Direct impacts:
- Investment: Capital formation
- Operations: Ongoing economic activity
- Manufacturing: Industrial output
- Exports: Trade balance improvement
Multiplier effects:
Total Impact = Direct + Indirect + Induced
Multipliers:
- Investment phase: 2.5-3.5x
- Operation phase: 1.5-2.5x
Country examples (2023):
- Denmark: 3.5% of GDP from wind
- Germany: €35 billion annual turnover
- China: Largest manufacturer globally
- USA: $20 billion annual investment
Employment Creation
Job categories:
| Phase | Jobs/MW | Type | Duration | |-------|---------|------|----------| | Manufacturing | 1.5-2.0 | Direct | Ongoing | | Construction | 0.5-1.0 | Temporary | 1-2 years | | O&M | 0.1-0.3 | Permanent | 20+ years | | Indirect | 2.0-3.0 | Supply chain | Various |
Global employment:
- 2023: 3.4 million jobs
- 2030p: 6+ million jobs
- Gender balance: 21% women (improving)
- Skill levels: 30% high-skilled
2. Regional Economic Development
Rural Economic Benefits
Income streams to rural areas:
- Land lease payments: $3,000-10,000/turbine/year
- Property taxes: Significant for rural counties
- Community funds: $1,000-5,000/MW/year
- Local employment: Construction, O&M
- Indirect benefits: Services, accommodation
Case study - Iowa, USA:
- Wind capacity: 12 GW (2023)
- Annual land lease: $60 million
- Property tax: $50 million
- Jobs supported: 10,000+
- Investment attracted: $25 billion cumulative
Hình: Economic benefits distribution in rural communities
Industrial Cluster Development
Successful clusters:
- Denmark: Entire value chain
- Germany: Technology leadership
- China: Manufacturing scale
- UK: Offshore expertise
Cluster success factors:
- Anchor tenants: Major manufacturers
- Supply chain: Local suppliers
- R&D facilities: Innovation centers
- Skills base: Technical workforce
- Infrastructure: Ports, transport
3. Energy Security Benefits
Import Substitution
Economic value:
Annual Savings = Wind Generation × Avoided Fuel Cost
Example (50 TWh wind):
- Gas avoided: €2.5 billion/year (@€50/MWh)
- Trade balance: Improved by same amount
- Price stability: Reduced exposure
Strategic benefits:
- Energy independence: Reduced imports
- Price stability: Fixed costs
- Supply security: Domestic resource
- Geopolitical: Reduced dependencies
Cost-Benefit Analysis
1. System Integration Costs
Grid Infrastructure
Additional costs for high penetration:
| Penetration | Extra Cost | Components | |-------------|------------|------------| | <10% | Minimal | Existing flex sufficient | | 10-20% | $5-10/MWh | Forecasting, operations | | 20-40% | $10-20/MWh | Grid reinforcement | | >40% | $20-40/MWh | Storage, transmission |
Cost allocation debates:
- Shallow: Developer pays connection only
- Deep: Developer pays all upgrades
- Hybrid: Shared based on benefits
Balancing Costs
Sources of balancing:
- Reserves: Spinning, non-spinning
- Storage: Batteries, pumped hydro
- Demand response: Flexible loads
- Interconnection: Geographic diversity
Cost trends:
- 2010: $10-15/MWh balancing cost
- 2020: $5-10/MWh (better forecasting)
- 2024: $3-7/MWh (market solutions)
- 2030p: $2-5/MWh (storage + flexibility)
2. External Costs and Benefits
Environmental Externalities
Avoided emissions value:
| Pollutant | Damage Cost | Wind Benefit | |-----------|-------------|--------------| | CO₂ | $50-100/ton | $25-50/MWh | | SO₂ | $5,000/ton | $2-5/MWh | | NOx | $3,000/ton | $1-3/MWh | | PM2.5 | $30,000/ton | $1-2/MWh | | Total | - | $30-60/MWh |
Health benefits:
- Reduced mortality: Air quality improvement
- Healthcare savings: Respiratory diseases
- Productivity: Fewer sick days
- Economic value: $20-40/MWh
Social Cost-Benefit
Full economic analysis:
Net Benefit = Benefits - Costs
Benefits:
+ Energy value
+ Capacity value
+ Environmental value
+ Health benefits
+ Energy security
+ Economic development
Costs:
- LCOE
- Integration costs
- Environmental impacts
- Social impacts
Typical result: Strongly positive
- Benefit/Cost ratio: 2-4x
- Payback period: 3-6 months (energy)
- Carbon payback: 3-8 months
Financial Risk Management
1. Technology Risk
Performance Risk
Mitigation strategies:
- Proven technology: Bankable turbines
- Warranties: OEM guarantees
- Insurance: Performance shortfall
- O&M contracts: Availability guarantees
Quantification:
- P50 production: 50% probability exceedance
- P90 production: 90% probability (conservative)
- Uncertainty: ±5-10% typical
- Energy yield assessment: Critical accuracy
Obsolescence Risk
Technology evolution impact:
- Larger turbines: Better economics
- Repowering option: Replace old units
- Lifetime extension: 25 → 30-35 years
- Residual value: End-of-life considerations
2. Market Risk
Price Risk Management
Hedging instruments:
- Long-term PPA: Price certainty
- Financial hedges: Derivatives
- Portfolio approach: Diversification
- Storage integration: Price arbitrage
Merchant risk quantification:
- Price scenarios: Monte Carlo simulation
- Capture rate: % of average price realized
- Correlation: Wind output vs prices
- Cannibalization: High penetration impact
Hình: Wind energy price risk in different market structures
Regulatory Risk
Policy uncertainty impacts:
- Subsidy changes: Revenue impact
- Market rules: Operational constraints
- Grid codes: Technical requirements
- Environmental: New restrictions
Mitigation approaches:
- Grandfathering: Protect existing
- Diversification: Multiple markets
- Stakeholder engagement: Policy influence
- Adaptive strategy: Flexibility built-in
3. Climate Risk
Resource Risk
Climate change impacts:
- Mean wind speed: ±5% by 2050
- Extreme events: Design considerations
- Icing risk: Northern climates
- Temperature: Density effects
Assessment methods:
- Climate models: Future projections
- Historical analysis: Trend detection
- Robust design: Resilience building
- Insurance products: Parametric coverage
Emerging Economic Models
1. Hybrid Projects
Wind + Solar + Storage
Economic synergies:
- Resource complementarity: Smoother output
- Infrastructure sharing: Grid, roads
- Higher capacity factor: Combined output
- Revenue optimization: Market arbitrage
Cost advantages:
- Shared development: -10% CAPEX
- Common O&M: -15% OPEX
- Grid connection: -20% cost
- Land use: More efficient
Financial performance:
- Project IRR: +1-2% improvement
- Risk reduction: Diversification
- Bankability: Enhanced credit
- PPA value: Firmer product
2. Green Hydrogen
Power-to-X Economics
Hydrogen production costs:
H₂ Cost = (Electricity Cost × 50 kWh/kg) / Efficiency + CAPEX/Operating Hours
Current: $3-5/kg
Target 2030: $1.5-2/kg
Revenue streams:
- Industrial H₂: Replace grey hydrogen
- Transport fuel: Heavy vehicles
- Energy storage: Seasonal balancing
- Synthetic fuels: Aviation, shipping
- Grid services: Flexible load
Project economics:
- Electrolyzer CAPEX: $500-1000/kW
- Efficiency: 65-75%
- Lifetime: 60,000-80,000 hours
- Capacity factor: Key to economics
3. Circular Economy
End-of-Life Value
Component recycling value:
| Material | Recovery Rate | Value ($/turbine) | |----------|---------------|-------------------| | Steel | 90-95% | 50,000-100,000 | | Copper | 85-90% | 20,000-40,000 | | Rare earth | 0-50% | 10,000-30,000 | | Composites | 20-30% | Limited currently |
Lifetime extension economics:
- Assessment cost: $50,000-100,000
- Upgrade cost: $100-300/kW
- Additional life: 5-10 years
- NPV positive: Most cases
Vietnam Market Analysis
1. Current Economics
Market Status (2024)
Installed capacity economics:
- Total installed: 4.7 GW
- Investment to date: $10+ billion
- Average LCOE: $65-85/MWh
- FiT rates: $98/MWh offshore, $85/MWh onshore
Challenges:
- Grid constraints: Curtailment issues
- PPA transition: From FiT to competitive
- Local content: Requirements vs capability
- Financing: International lender concerns
2. Future Potential
Economic Projections
2030 targets:
- Capacity: 18-20 GW wind
- Investment needed: $30-40 billion
- Job creation: 50,000+ direct
- LCOE projection: $40-60/MWh
Success factors:
- Grid investment: Transmission expansion
- Market mechanism: Functional wholesale market
- Regulatory clarity: Stable framework
- Industrial development: Local supply chain
- Financing: Green bonds, international support
3. Policy Recommendations
Economic Optimization
Key policies needed:
- Direct PPA: Allow corporate purchasing
- Grid investment: Cost allocation clarity
- Storage incentives: Enable integration
- Industrial policy: Local manufacturing
- Carbon pricing: Internalize externalities
Economic benefits potential:
- GDP contribution: 1-2% by 2030
- Trade balance: Reduced energy imports
- Rural development: Significant income
- Technology transfer: Industrial upgrade
Kết Luận
Thành Tựu Kinh Tế
- Cost competitiveness: Achieved grid parity globally
- Scale achieved: Trillion dollar industry
- Job creation: Millions employed worldwide
- Rural benefits: Significant income streams
- Energy security: Import substitution value
Xu Hướng Tương Lai
- Continued cost reduction: Learning curve persistence
- Market integration: Flexibility products
- Hybrid projects: Optimized systems
- Green hydrogen: New revenue streams
- Circular economy: Sustainable lifecycle
Key Insights
Wind energy economics đã chứng minh:
- Khả năng cạnh tranh: Không cần trợ cấp ở nhiều thị trường
- Lợi ích kinh tế rộng: Vượt xa chỉ sản xuất điện
- Động lực đầu tư: Risk-return profile hấp dẫn
- Tương lai bền vững: Economics + Environment aligned
Thành công kinh tế của năng lượng gió không chỉ là câu chuyện về công nghệ, mà còn về cách thị trường, chính sách và đổi mới kết hợp để tạo ra một trong những câu chuyện thành công lớn nhất của thế kỷ 21 trong lĩnh vực năng lượng sạch.
Chương cuối cùng sẽ khám phá lịch sử phát triển của tuabin gió hiện đại, từ những thí nghiệm đầu tiên đến ngành công nghiệp toàn cầu ngày nay.