Môi Trường và Xã Hội
Tác động môi trường và xã hội của năng lượng gió
Trung Cấp
31 phút đọc
Giới Thiệu
Năng lượng gió được công nhận là một trong những nguồn năng lượng sạch nhất, nhưng như mọi công nghệ quy mô lớn, nó vẫn có những tác động đến môi trường và xã hội. Chương này sẽ phân tích toàn diện và cân bằng cả lợi ích lẫn thách thức, dựa trên nghiên cứu khoa học và dữ liệu thực tế.
Tổng Quan Tác Động
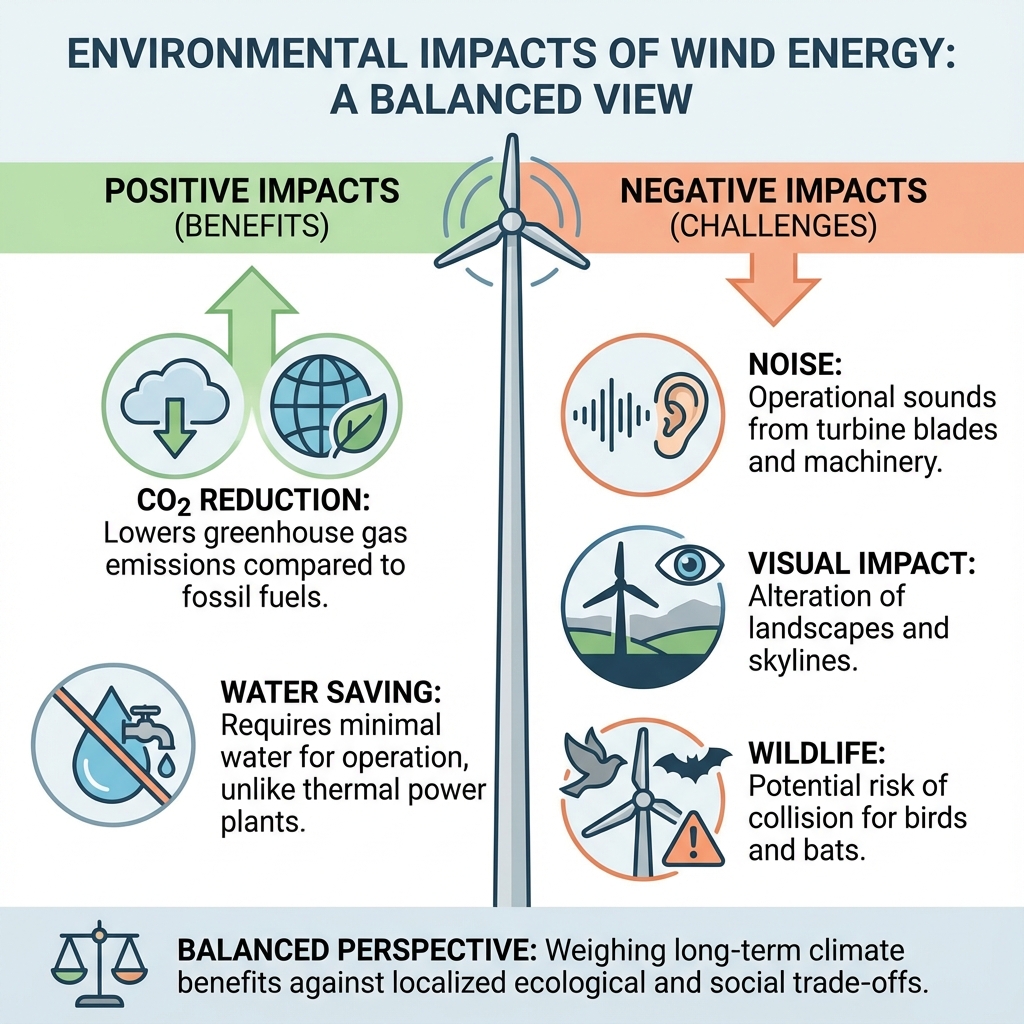
Tác động tích cực:
- Giảm phát thải khí nhà kính
- Không ô nhiễm không khí
- Tiết kiệm nước
- Tạo việc làm xanh
Tác động cần quản lý:
- Tiếng ồn cục bộ
- Ảnh hưởng đến động vật hoang dã
- Thay đổi cảnh quan
- Vòng đời vật liệu
Giới Thiệu
Năng lượng gió được công nhận là một trong những nguồn năng lượng sạch nhất, nhưng như mọi công nghệ quy mô lớn, nó vẫn có những tác động đến môi trường và xã hội. Chương này sẽ phân tích toàn diện và cân bằng cả lợi ích lẫn thách thức, dựa trên nghiên cứu khoa học và dữ liệu thực tế.
Tổng Quan Tác Động
Tác động tích cực:
- Giảm phát thải khí nhà kính
- Không ô nhiễm không khí
- Tiết kiệm nước
- Tạo việc làm xanh
Tác động cần quản lý:
- Tiếng ồn cục bộ
- Ảnh hưởng đến động vật hoang dã
- Thay đổi cảnh quan
- Vòng đời vật liệu