Lịch Sử Tuabin Gió Hiện Đại
Phát triển lịch sử của công nghệ tuabin gió từ 1888 đến hiện tại
Cơ Bản
34 phút đọc
Giới Thiệu
Lịch sử tuabin gió hiện đại là câu chuyện về sự tiến hóa không ngừng, từ những thí nghiệm khiêm tốn của thế kỷ 19 đến ngành công nghiệp trị giá 200 tỷ USD hiện nay. Chương này sẽ trình bày chi tiết dòng thời gian phát triển, những cột mốc quan trọng, và tầm nhìn tương lai của công nghệ năng lượng gió.
Tổng Quan về Sự Tiến Hóa
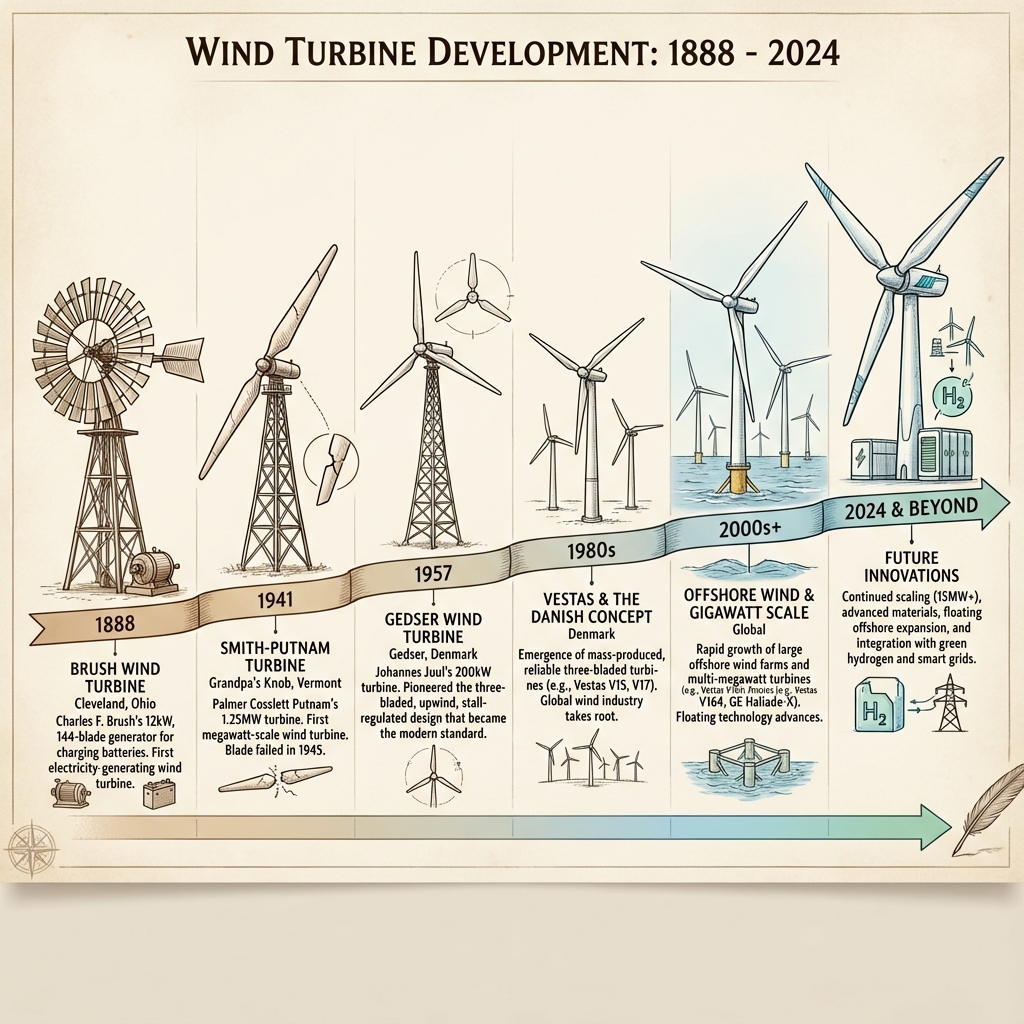
Các giai đoạn chính:
- Kỷ nguyên Tiên phong (1888-1950): Những thí nghiệm đầu tiên
- Nền tảng Hiện đại (1950-1980): Khoa học cơ bản
- Sự ra đời của Thương mại hóa (1980-2000): Thương mại hóa
- Thị trường Đại chúng (2000-2010): Tăng trưởng nhanh chóng
- Kỷ nguyên Trưởng thành (2010-2024): Công nghiệp toàn cầu
Giới Thiệu
Lịch sử tuabin gió hiện đại là câu chuyện về sự tiến hóa không ngừng, từ những thí nghiệm khiêm tốn của thế kỷ 19 đến ngành công nghiệp trị giá 200 tỷ USD hiện nay. Chương này sẽ trình bày chi tiết dòng thời gian phát triển, những cột mốc quan trọng, và tầm nhìn tương lai của công nghệ năng lượng gió.
Tổng Quan về Sự Tiến Hóa
Các giai đoạn chính:
- Kỷ nguyên Tiên phong (1888-1950): Những thí nghiệm đầu tiên
- Nền tảng Hiện đại (1950-1980): Khoa học cơ bản
- Sự ra đời của Thương mại hóa (1980-2000): Thương mại hóa
- Thị trường Đại chúng (2000-2010): Tăng trưởng nhanh chóng
- Kỷ nguyên Trưởng thành (2010-2024): Công nghiệp toàn cầu